Why PeakSync?
Designed for investors who want an edge they can explain
-
3 flagship portfolios: a simple lineup built for clear choices
-
Transparent rules: factor scoring you can understand
-
Each portfolio includes a short-term U.S. Treasury blend to help control drawdown
Evidence, not vibes—hypothetical backtests with CAGR, Sharpe, and drawdown.
An AI-powered research terminal is included:
-
Macro Dashboard: trend + risk regime in one view
-
Research Analyst: Turn headlines + fundamentals into a clean, explainable thesis.
-
Market Briefs: headline scanning with clickable sources
-
Signals & Downloads: grab holdings and rebalance instructions
-
Risk Desk: drawdown, concentration, and turnover check
How it works?
1) PeakSync ranks the S&P 500 with factor sleeves
Each sleeve scores stocks using transparent, rules-based signals.
2) PeakSync combines the sleeves into 3 flagship portfolios
Each portfolio offers a distinct mix of diversification and Treasury-buffered drawdown control.
3) You mirror the trades in your own account
Monthly constituent refreshes keep the system current while you stay in control of execution.
.png)
.png)
$50 Month Full Access
Your subscription includes access to the portfolios and terminal:
-
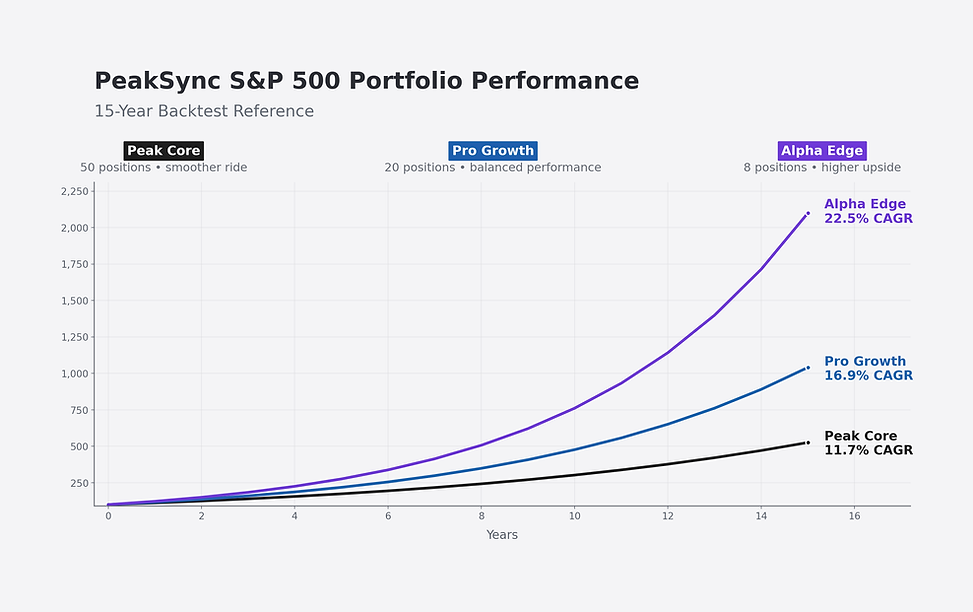
3 S&P 500 Portfolios 15-yr Backtested
Peak Core 11.7% Annual Returns
Pro Growth 16.9% Annual Returns
Alpha Edge 22.5% Annual Returns
-
AI Powered Research Terminal
Macro Dashboard
Research Analysis
Buy, Sell and Hold Signals
News Briefs
Risk Desk
Each flagship portfolio combines rules-based S&P 500 stock selection with a short-term U.S. Treasury blend designed to support smoother long-term compounding.
PeakSync 15 Year Portfolio Performance
Illustrative, pre-fee & pre-cost. Past performance is not indicative of future results. Designed for long-term, sleep-at-night investing.
50 Position Portfolio
Peak Core
15Y CAGR
11.7%
20 Position Portfolio*
Pro Growth
15Y CAGR
16.9%
Annual Turnover
55%
Annual Turnover
81%
Sharpe
0.86
Sharpe
1.00
8 Position Portfolio*
Alpha Edge
15Y CAGR
22.5%
Annual Turnover
319%
Sharpe
0.99
Max Drawdown
-19%
Max Drawdown
-22%
Max Drawdown
-30%
*8 and 20 position portfolios are more concentrated and may have higher expected volatility and drawdowns.
Backtested, weekly(8 position) and monthly(20 and 50 position) rebalance; pre-fee & pre-cost; estimated 0.10% slippage.
Who PeakSync Is For
PeakSync is built for investors who:
-
Want more than index funds, but don’t want to live inside spreadsheets or day-trade.
-
Prefer rules over gut feel, and are comfortable with a systematic process.
-
Like seeing clear, long-term stats—CAGR, Sharpe, drawdown—before committing capital.
-
Want portfolios they can implement through their existing brokerage or advisor.
If you think in terms of sleeves, factors, and long-term discipline, PeakSync was built for you.
Compliance and Expectations
PeakSync provides rules based factor model portfolios and quantitative research for educational and informational purposes only. PeakSync does not manage money, provide personalized investment advice, or guarantee future results.
All performance figures shown are hypothetical backtests on the S&P 500, based on specific rules, assumptions, and data sources, and are before fees and taxes. Real-world results will differ from backtested performance. Past performance is not indicative of future results.
If you choose to implement any model portfolio, you are responsible for your own investment decisions and for understanding the risks involved.